
tl;dr
A time series — a set of time-stamped observations of a phenomenon — can be “decomposed” into three components:
Trend
Seasonal
Residual
This can be performed using Python’s
statsmodelspackage. Specifically, a time series is decomposed using either an additive or a multiplicative model, depending on how varied the seasonal component is across the given time period.
This is the first in what will be a series of pieces focused on conducting time series analysis and forecasting using Python. My belief is that upskilling in this area will help you (and any teams you’re a part of, by extension) better strategize and operationalize in the pursuit of your desired outcomes.
Rather than frontloading you with too much discussion about it, allow me to challenge you to take the next 20 minutes and install the tools we’ll be using over the coming weeks. After some brief remarks about them, we’ll walk through how to decompose a time series together!
Upon setting up your GitHub account and installing the GitHub Desktop app, you are immediately better-poised to take greater control over every version of every contribution to every project you work on — forever. Words cannot adequately impress upon you what this means for your productivity, but you’ll know experientially soon enough.
Additionally, installing VS Code straightaway will help you sidestep the inane chatter about which IDE you should use to produce your work, which is just jargon for the text editor into which you’ll be typing. I have a similar sentiment about installing the Anaconda distribution of Python, as it puts aside any questions you might have about the opportunity cost of learning that language as opposed to starting with another (the Python vs. R “debate” comes to mind). If you continue along this path, it is not only likely that you’ll learn multiple scripting and query languages, but also that you’ll quickly realize the relative merits of selecting Python as your jump-off.
To summarize what we’ve covered to this point, I am going to assume you have installed the following:
GitHub Desktop
VS Code
Anaconda Individual Edition
Let’s jump in!

How to perform time series composition is the first topic covered in my time series course…but what does it mean and why should we care? As you might imagine, a time series is simply a collection of sequential, individually time-stamped observations. Taking that as a given, you can easily conjure up an image in your mind of what a time series plot looks like, as we’re basically inundated with them on a daily basis.
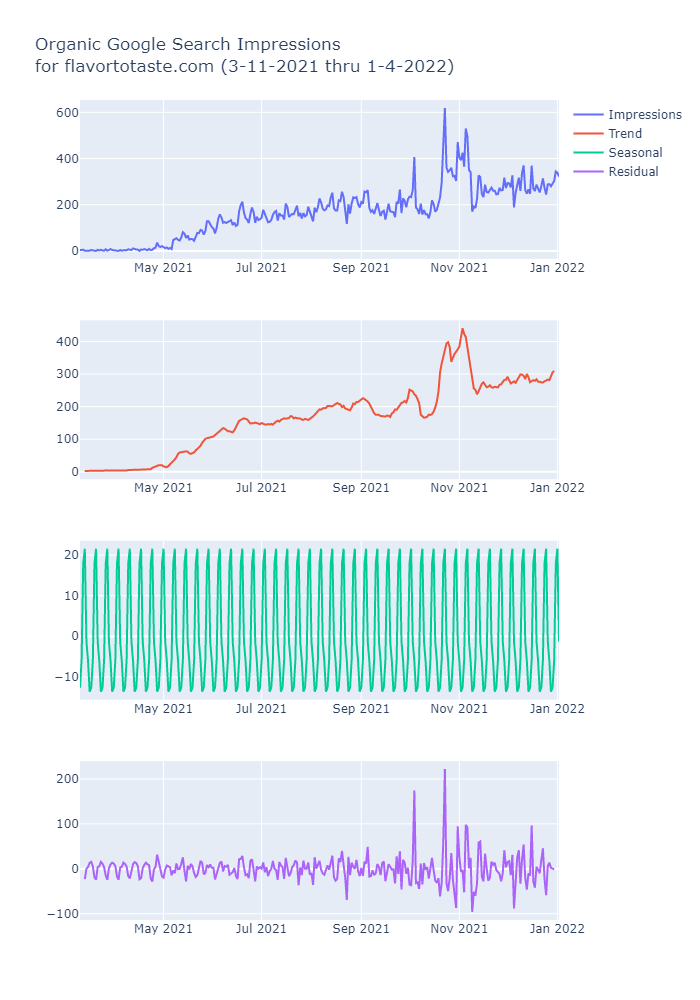
Well, imagine a smidge further with me. Any individual time series can be broken down into a few useful components, namely the trend, seasonal, and residual components. Using what is known as an additive model (as opposed to a multiplicative model) to decompose a time series into these three components, the implication is that the observed time series data can be “reconstructed” by adding the components together. Take as an example the organic Google Search traffic for a website I built; a plot of the decomposed impressions data is shown below:
Soooooooo, how exactly do we perform time series decomposition with Python?! We can think of it as a three-step workflow:
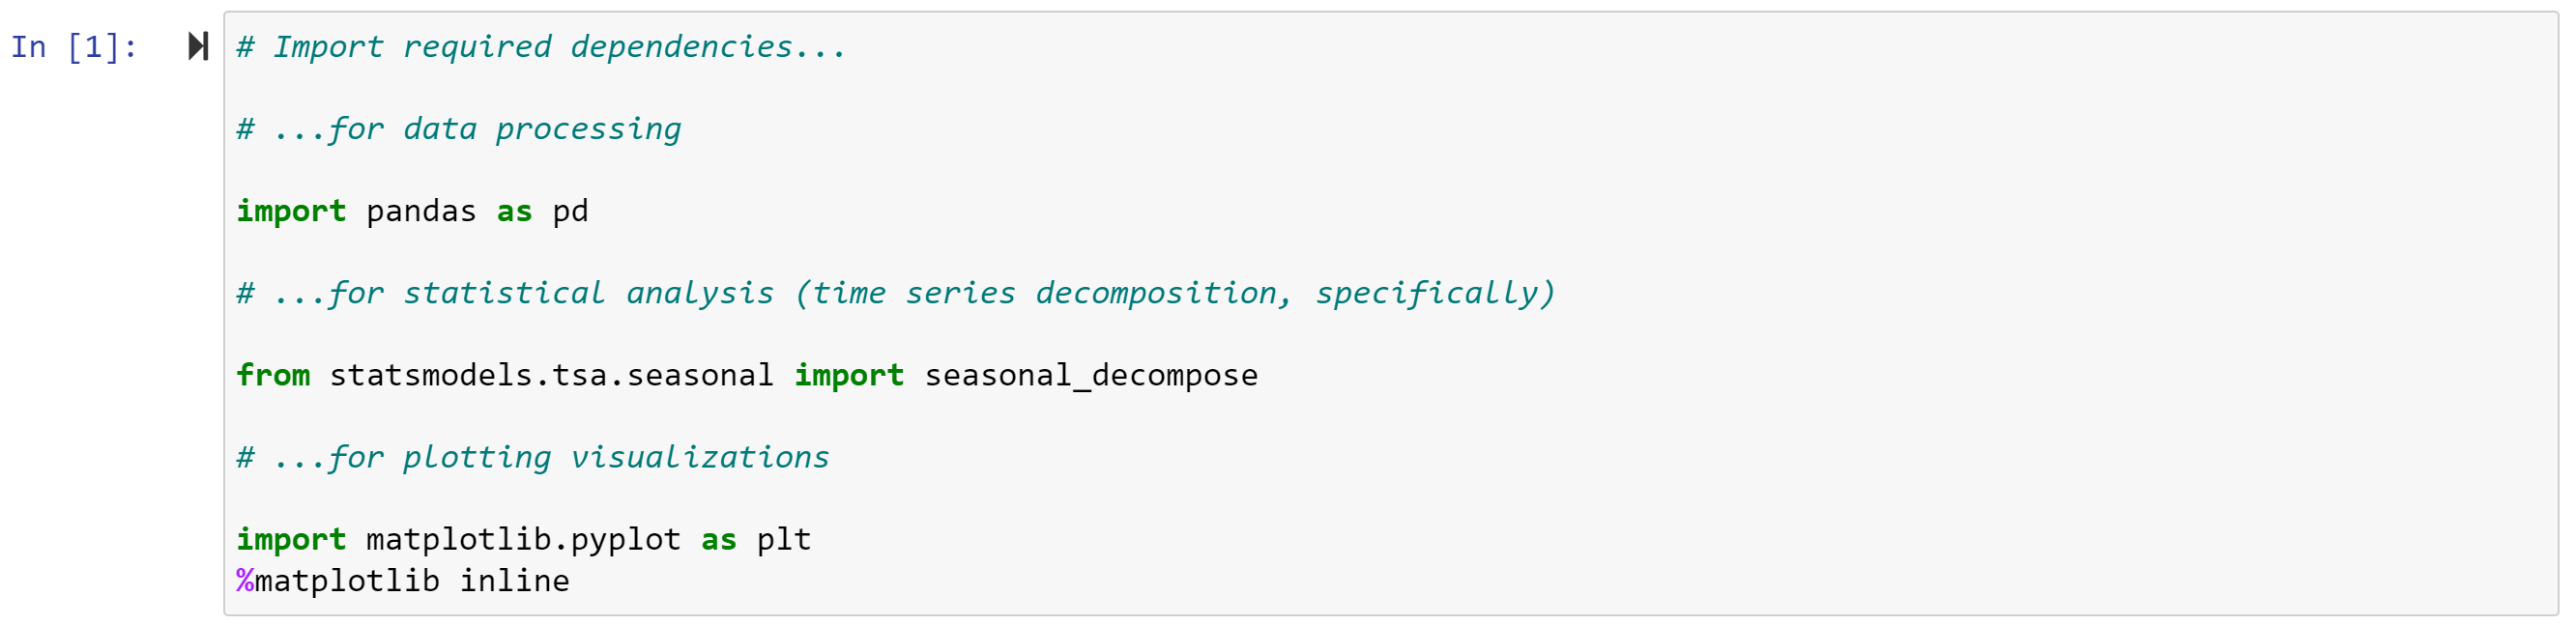
Import the data processing and visualization tools, as well as the statistical analysis toolkit (namely
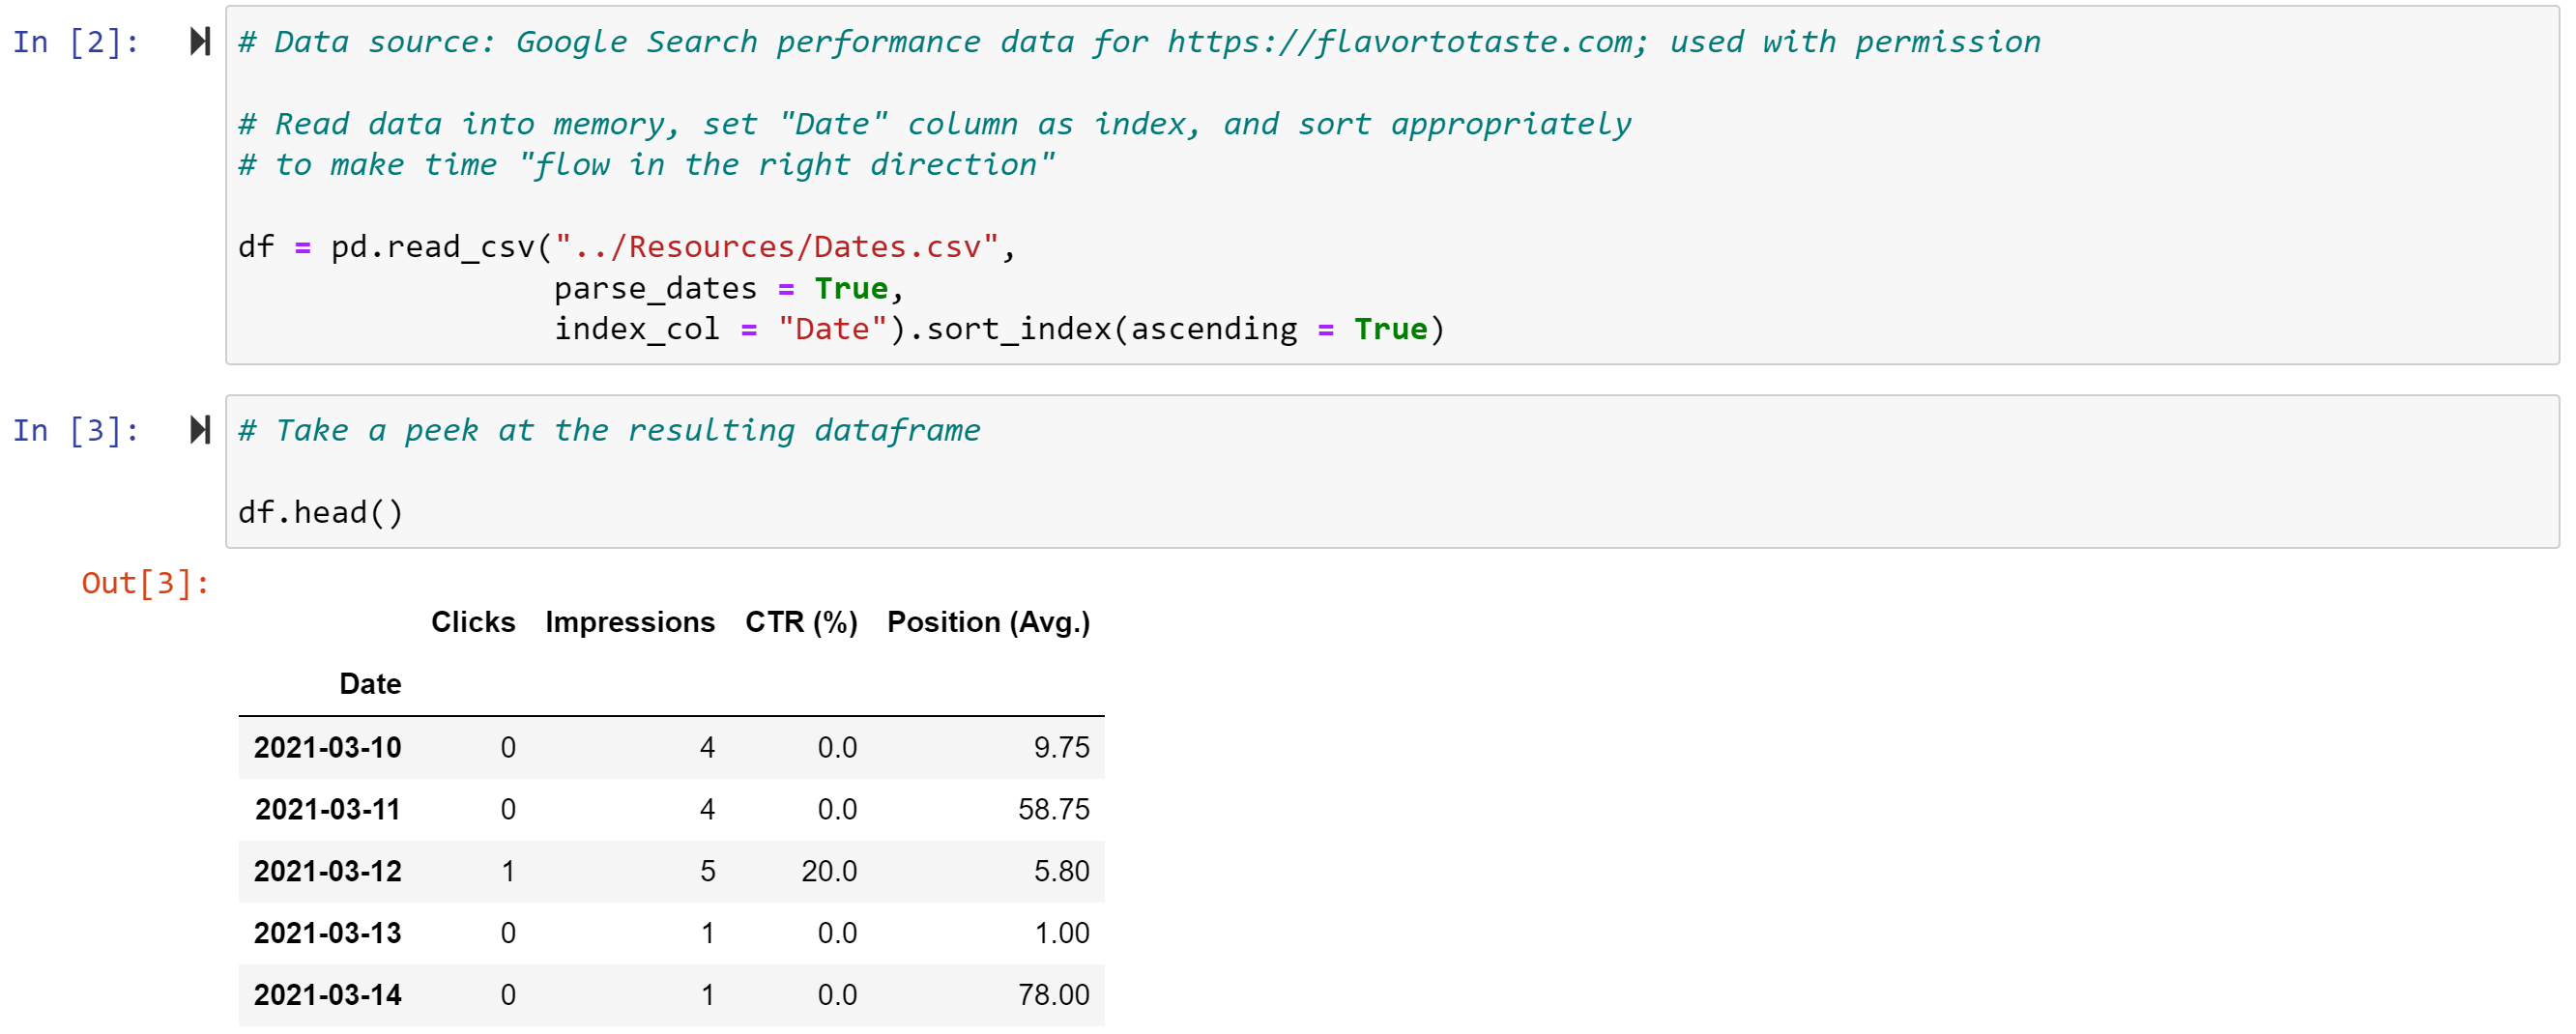
pandas,matplotlib, andstatsmodels)“Load” (read into memory) the time series data
Plot (visualize) the decomposed data
Step 1:
Step 2:
Step 3:
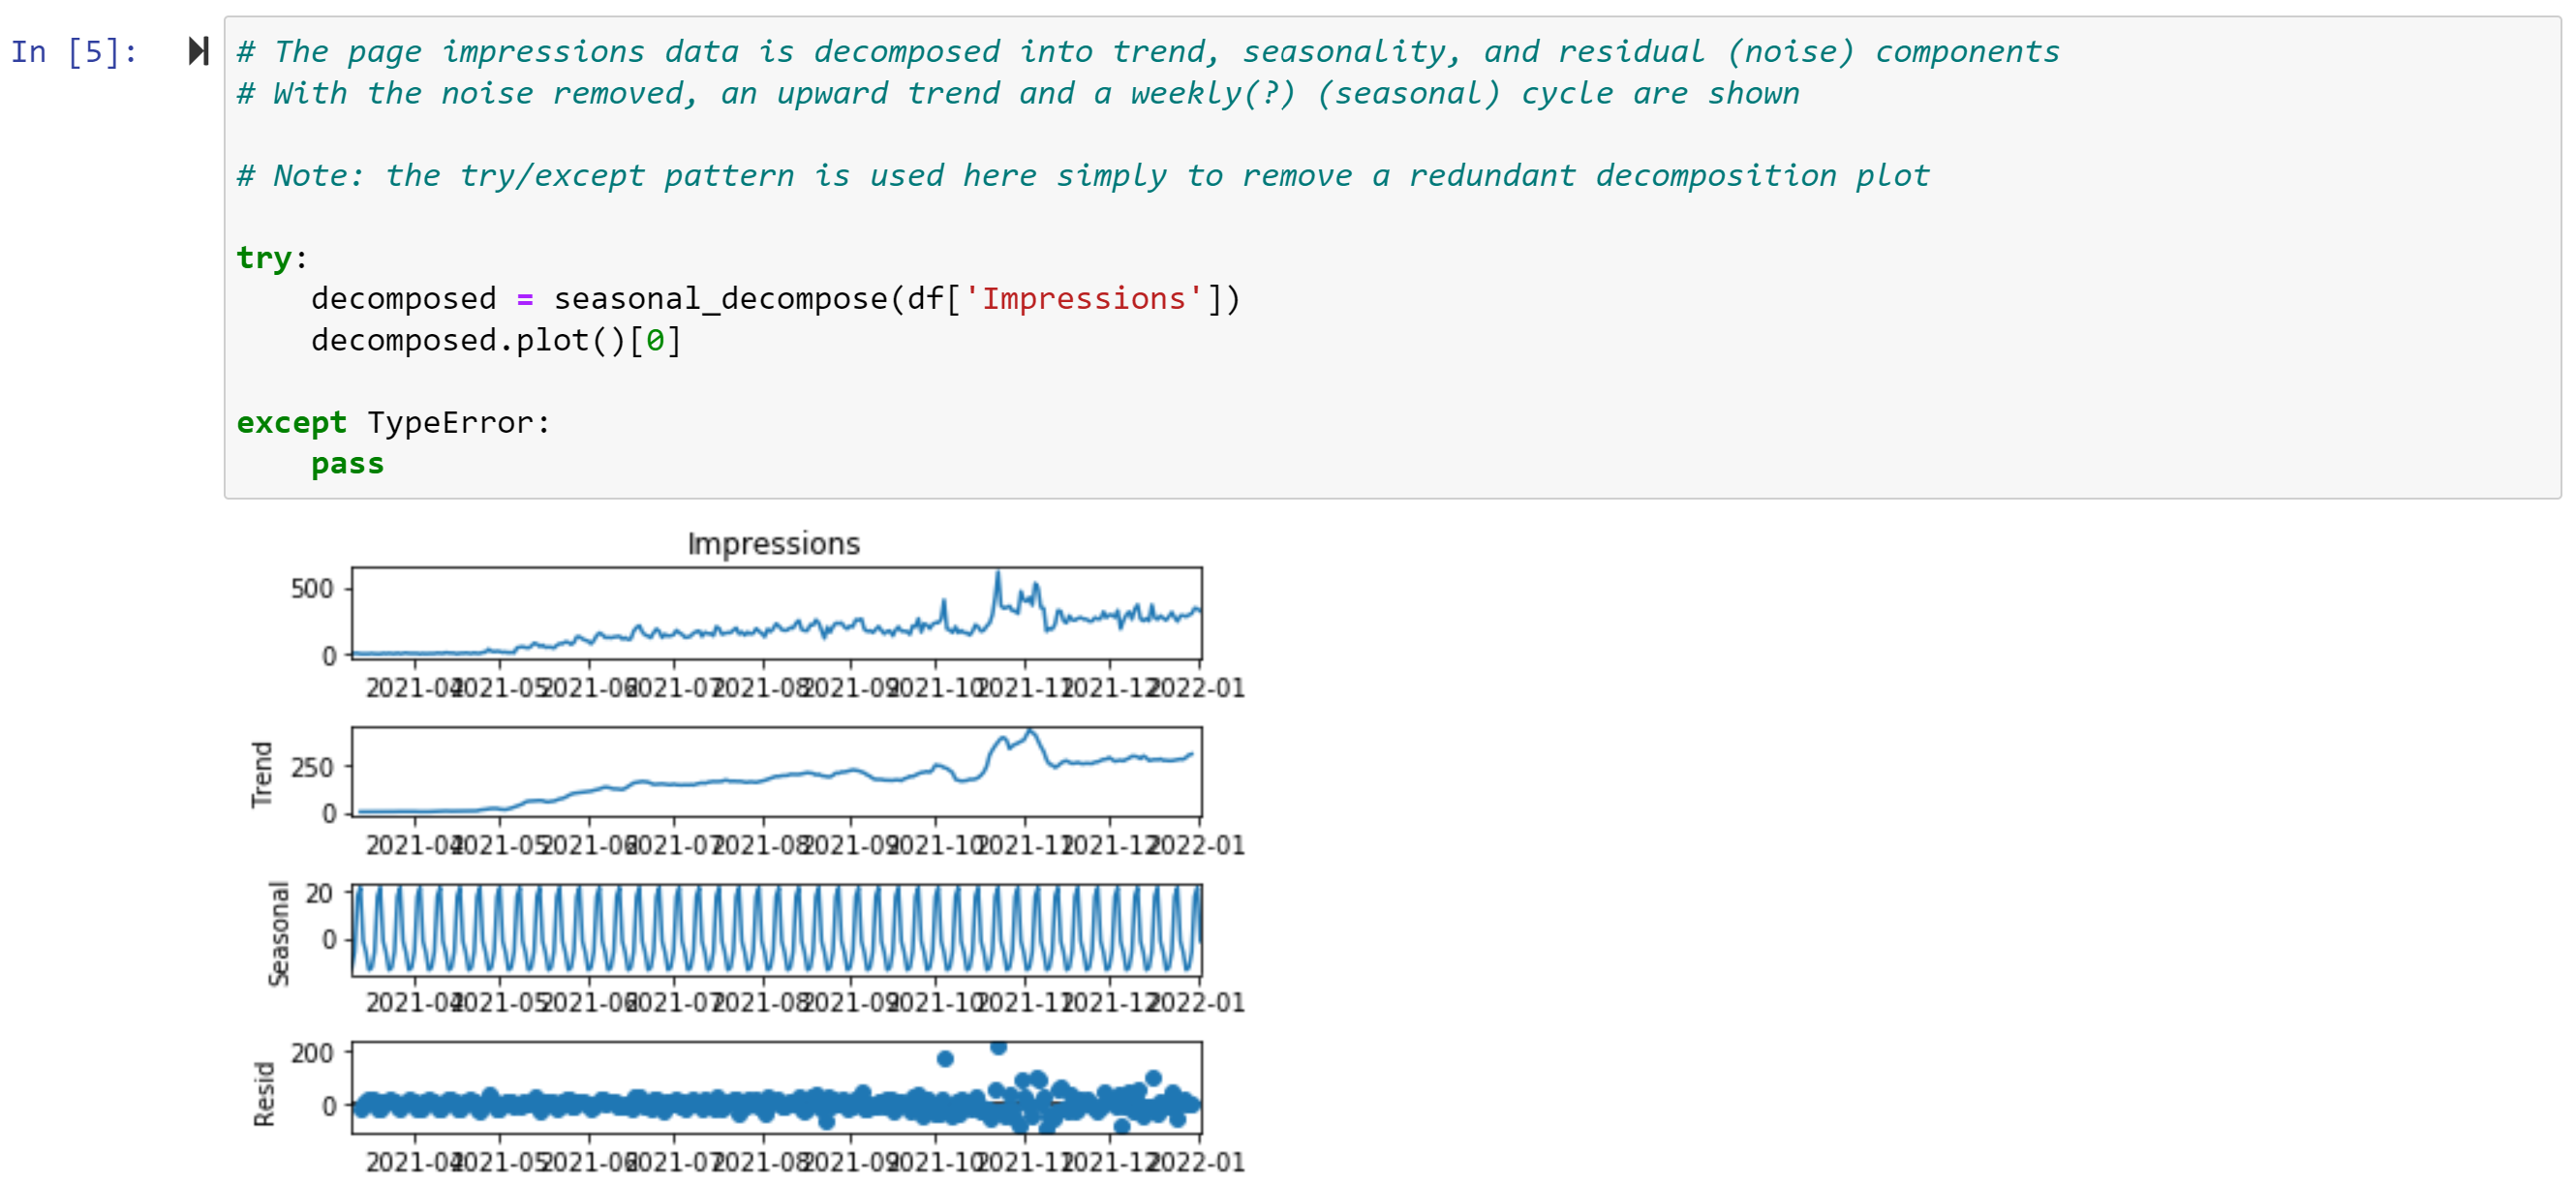
The additive model was used, given that the magnitude (amplitude) of the seasonal variation does not vary with the level of the series, though it should also be noted that it is the default model that is applied when performing time series decomposition with Python’s statsmodels package. Some of the elements of the decomposition plot are ugly out-of-the-box, but I take time to show you how to create a prettier one using Plotly in the first of the preview modules on my time series course landing page.
In addition to installing the tools (hopefully), you just walked through how to perform time series decomposition using Python! Believe me when I say that it’s much more fun than doing it using Excel…
If you enjoyed this article, please subscribe and consider sharing with your friends. Regardless, thanks for reading and please also feel free to connect!